

Statistical data analysis and spss graph
€5.00
Show the financial return in a sequence from the largest to the smallest of all analyses as a graph.
Date-by-date financial return as a graph
Showing the entire month’s financial return as a graph
Presentation of data in tables and graphs on Word file
All 4 trunks are required for €5
Instruction
Please send your information after buying
Only logged in customers who have purchased this product may leave a review.
Related products
-

Unloading, organizing, entering and reviewing data €5 per 25 pages/1500 cell
€5.00 Add to cart
Unloading, organizing, entering and reviewing data €5 per 25 pages/1500 cell
Conversion of data from PDF to MS Word
Conversion of data from PDF to EXCEL program
– Move data from websites to Excel or vice versa
– Convert any filmed file to Word and reformulate it
– Data entry capability for websites and special programs
– Data entry in Arabic, English and German
– Unload audio files
Service price:
€5 per 5,500 words
€5 per 1,500 cells
€5 per hour audio or video recording
€5.00 -

A sound dump in English or Arabic for €5
€5.00 Add to cart
A sound dump in English or Arabic for €5
You have experience with years of research and study in English (I’ve got IELTS score 7) and I will best serve the client by converting audio or video files into a written file, whether in English or Arabic.
– I have three years of experience with sound discharge.
I use programs like Express Scribe to present the content professionally.
– Audio discharge of audio or video
– Total service time depends on the number and duration of files
Prices:
For Arabic €5 per 8 minutes
For English €5 per 6 minutes
Add €5 if the file has accents
€5.00 -

Boost your Alexa site ranking with 2500 Do-Follow Linux Backup
€5.00 Add to cart
Boost your Alexa site ranking with 2500 Do-Follow Linux Backup
Alexa Site Ranking Promotion with 2500 Do-Follow Linux Backup.
€5.00 -
Modify to word and excel files and make pdf files
€5.00 Add to cart
Modify to word and excel files and make pdf files
I will make any word file or Excel file or PowerPoint file or convert any text file containing 10000 words into a pdf file for only €5 and with every mastery and speed.
And change it until you’re fully satisfied. We are pleased that you have reached out to us and asked for service.
And we promise you the best results.
€5.00 -
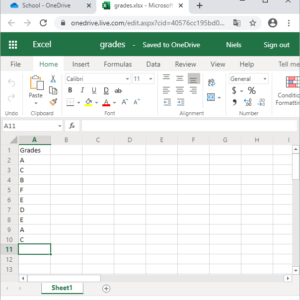
I will do any work in excel program for € 5
€5.00 Add to cart
I will do any work in excel program for € 5
I’ll be entering data in Microsoft Excel and writing vba scripts in the form of a macro. All the more complex calculations can be performed automatically by the vba functions. It is also possible to merge multiple excel files into one file.
Enter 500 cells from excel file for € 5
€5.00 -
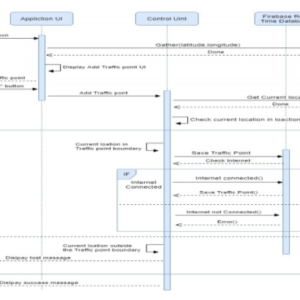
UML Diagrams
€5.00 Add to cart
UML Diagrams
I can draw UML diagrams including:
Use case diagram
Class diagram
Sequence diagrams
Activity diagram
€5.00
Reviews
There are no reviews yet.